5 charts showing Trump’s immense post-election market impact
Donald Trump’s election victory immediately sent financial markets into a frenzy.
Stocks soared to records on the prospect of tax cuts and looser regulation. Bank stocks in particular got a lift amid speculation of increased deal activity.
Bond yields also surged as investors priced in the expectation that Trump’s protectionist trade policies will be inflationary, complicating plans for further rate cuts. This led to renewed interest in money-market funds. The dollar rose and gold dipped.
Cryptos of all sorts charged higher, with bitcoin setting a series of records above $90,000 as traders looked ahead to lighter regulation from the self-appointed “crypto president.”
A group of Bank of America analysts led by Michael Hartnett, the chief investment strategist of BofA Global Research, took stock of the recent moves.
Below are five charts that show just how extreme market fluctuations have been across assets:
1.Large-cap stocks saw their biggest weekly inflow ever.
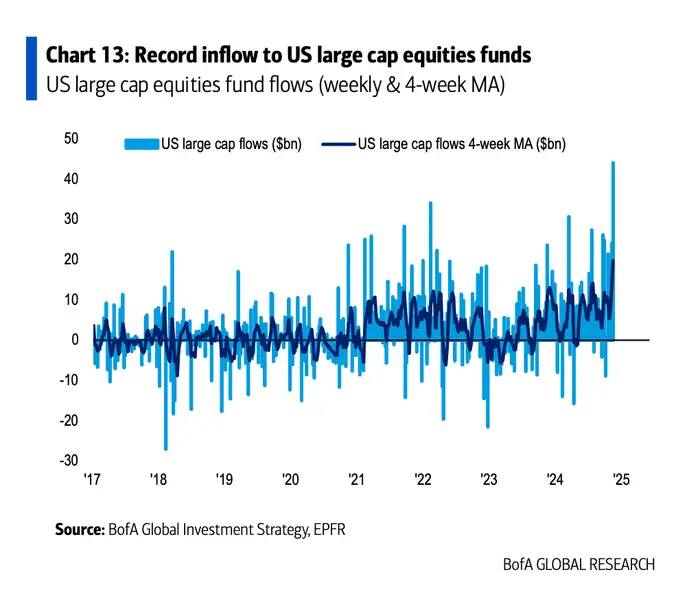
Large-cap US stocks took in $44.1 billion last week, its largest week of inflows on record.
2.Financial stocks saw their biggest inflow in more than two years.
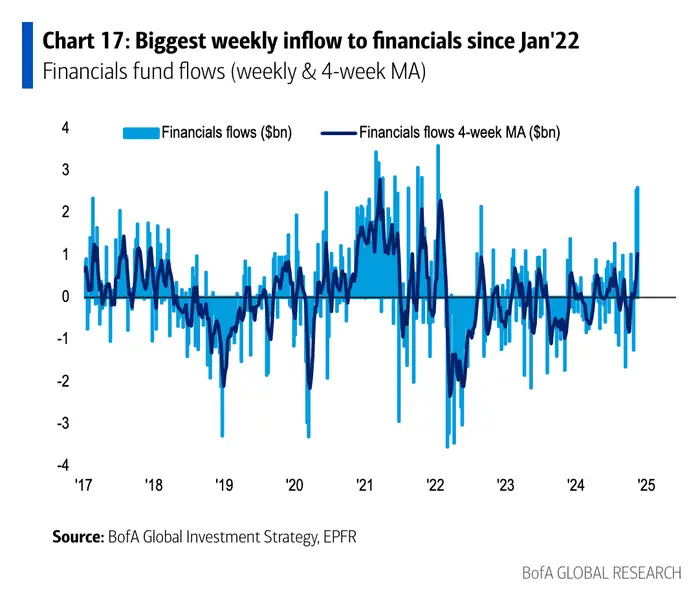
Financial funds took in $2.6 billion, the largest week of inflows since January 2022.
3.Gold saw its biggest outflow in more than two years.
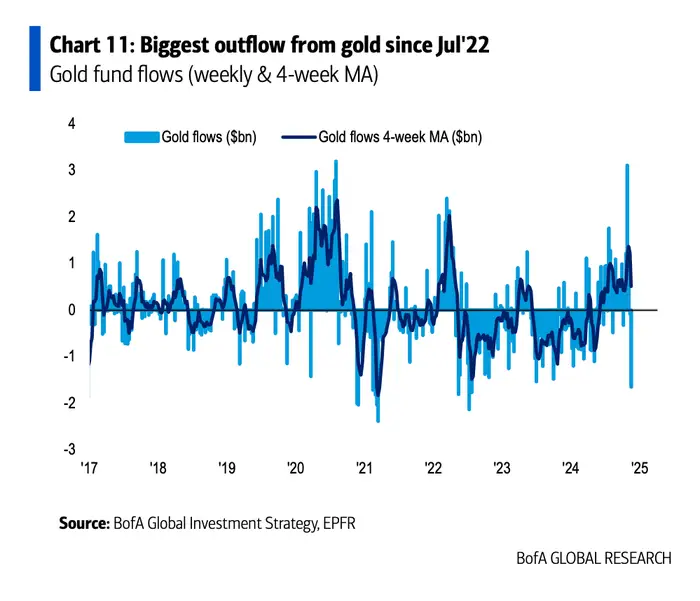
Gold saw $1.6 billion in outflows, the steepest pace of weekly selling since July 2022.
4.Money-market fund assets reached an all-time high.
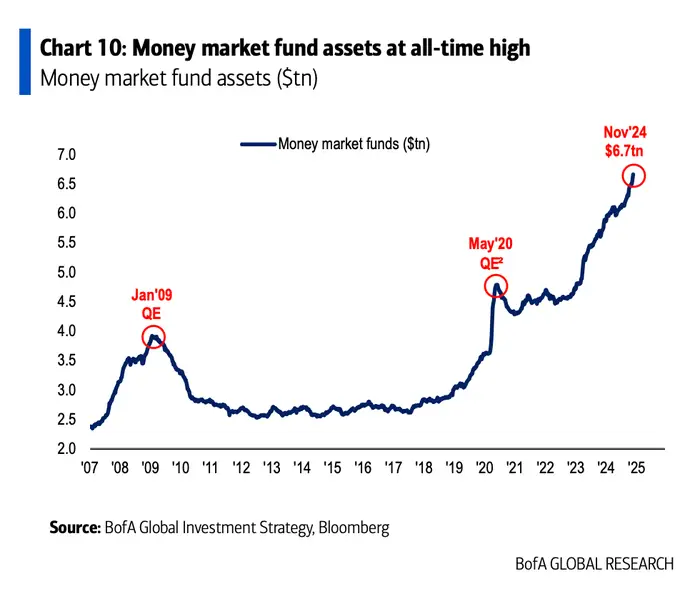
Assets in money market funds rose to a record $6.7 trillion.
5.Crypto saw its biggest week of inflows on record.
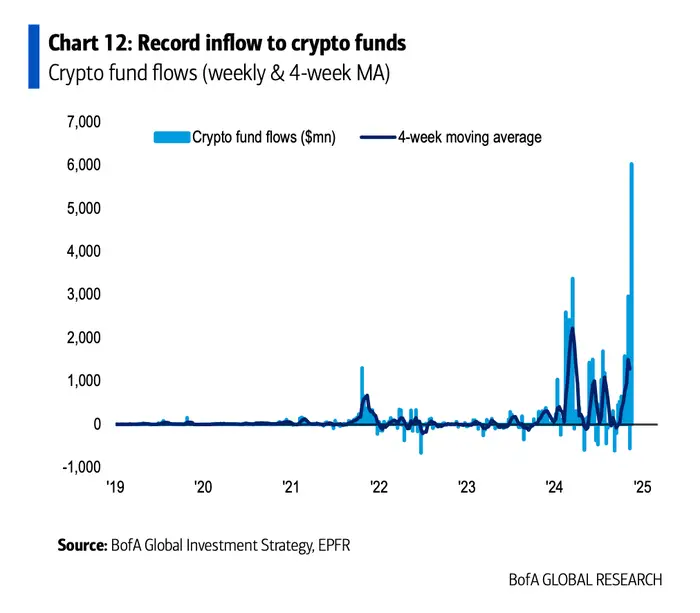
Crypto funds took in $6 billion last week, the largest week of inflows on record.


