5 charts signaling a stock market correction in the first quarter of 2025. Plus, when to take profits.

“Sentiment is a little out of control on the upside; almost every single sentiment indicator I have is showing so many bulls,” Meisler said.
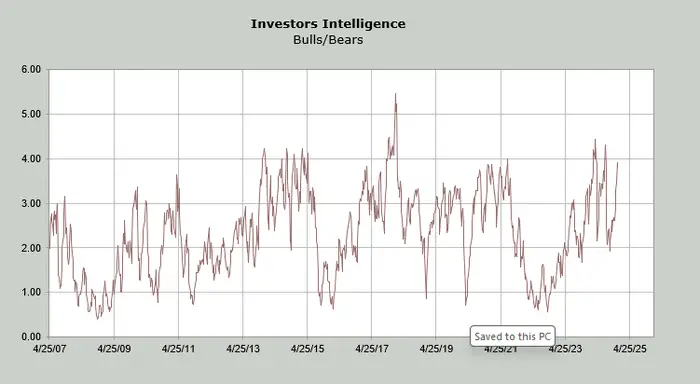
The chart below shows the ratio between bulls to bears sits at 3.9. Anything above 3 means extreme optimism and potentially an overbought market. Historically, readings over 4 tend to signal areas where the market begins to reverse, entering a correction, she noted.
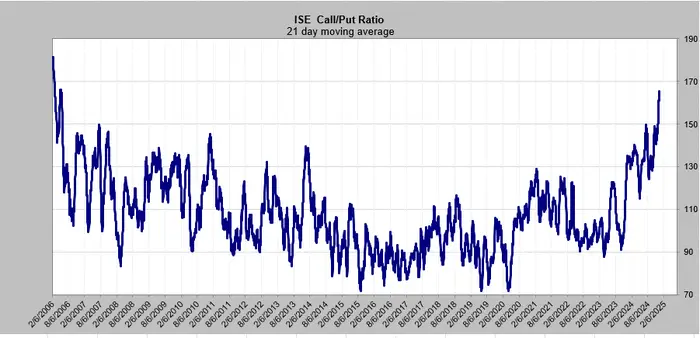
The options market is another place to look for bullish or bearish signals. Call options, which give the buyer the right to purchase a stock at a fixed price, have bypassed the volume of puts, which give the buyer the right to sell. This means there’s more trader optimism about rising stock prices.
Below is a chart showing the ISE call-to-put ratio’s 21-day moving average. The tilt toward calls is at its highest since 2006, when it started being tracked. While Meisler noted that it could continue to climb, it’s likely to correct because the last time it hit this record high, the S&P 500 experienced an 8% correction, as demonstrated by the chart below.
The second set of indicators are those already flashing a slowdown. Right now, despite investor optimism, behavior tells a different story.
“People are selling these stocks,” Meisler said. “And if you were thinking the market is going to be super terrific next year, why are you selling stocks now? Because somebody doesn’t think the market is going to be super terrific next year is, I guess, how I would term it.”
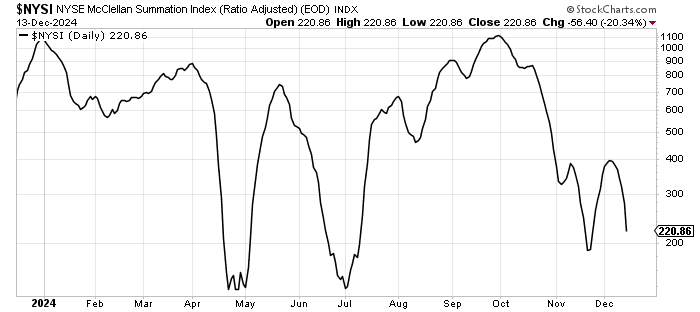
Here, Meisler reverts to the breadth of the broader market, which is losing momentum overall as indicated by the McClellan Summation Index, a measurement comparing rising stocks versus those declining. Since October, the index dropped sharply and has not yet recovered, which means investor behavior is turning to bearish territory.
Additionally, a smaller number of stocks are making new highs. The chart below shows a sharp drop in stocks on the New York Stock Exchange that are hitting peak prices.
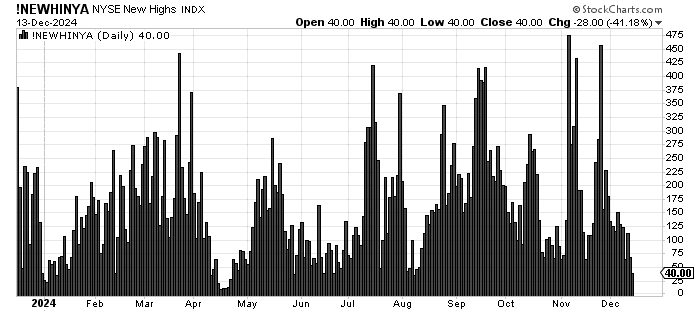
About 474 stocks made new highs on the New York Stock Exchange the day after the election, and from there, new highs have gradually declined. Meanwhile, the S&P 500 is higher today than it was then, which means a small number of mega-cap tech stocks continue to lead the index.
“That’s not exactly what I call broadening out. That’s narrowing,” Meisler said.
The chart below shows that the number of new stocks making lows on the New York Stock Exchange is rising.

At an S&P 500 between 6000 to 6100, the stock market needs a reset, which is why Meisler anticipates a market correction in the first quarter of 2025. And while she can’t gauge the depth of that correction, she said that it’ll be one worth taking profits for in December.


