A poker player turned trader up 253% this year details how he picks which stocks to target — and the event-driven strategy he uses to maximize gains

“All the natural human instincts you have, you have to do the complete opposite in almost every circumstance to be a successful trader,” said Christian Flanders.
In the early 2000s, Flanders was a trading assistant at a bond-trading firm by day and a professional online poker player by night. Both occupations served as meaningful sources of income for him — that is until the 2008 financial crisis closed down his firm, and eventually regulation shut down many poker sites, too.
By 2017, he decided he had to pivot and elected to give stock trading a try. His appetite for risk and uncertainty made for a smooth transition.
“I actually started off well, which is probably worse in some ways than good,” Flanders said of those early days. He recalls generating gains of nearly 50% by the end of 2017, performance that set him up for unrealistic expectations and, eventually, disappointment. The following year, he saw most of those gains quickly evaporate after a series of bad bets he made from chasing hype.
At the time, shorting volatility had been all the hype. Flanders recalled reading a story about a Target employee who became a millionaire, going from $500,000 to $12 million in five years after shorting the CBOE Volatility Index — or VIX. It ultimately amounted to a bet that the stock market would stay placid, with interest rates having been near zero for so long. Excited about the prospect, he wanted to replicate the success by buying the ProShares Short VIX Short-Term Futures ETF (SVXY), an inverse ETF that shorts the VIX.
On February 5, 2018, he bought multiple shares of SVXY totaling 3,000 at an average split-adjusted price of $67. It had been on a strong uptrend over the previous two years. The fund was down sharply that week. Flanders saw it as a chance to get in cheap with the assumption it would recover. But it never did. He sold at an average split-adjusted price of $35, according to his brokerage statement. That’s when he learned his biggest lesson: that managing his emotions was 95% of the process.
“Your emotions are going to make you do the wrong thing at exactly the worst time,” Flanders said. “You’re going to panic-sell at the lows; you’re going to panic-buy at the highs. You’re going to trade when the stock is zigging and zagging and get chopped up. When the stock finally breaks out, you’re going to short it. When the stock finally breaks down, you’re going to buy it.”
He realized that a combination of sticking to a strict rules-based process that involved filtering the right stocks, trading the same patterns, and setting stop losses was the only way he could manage his reactions. This way, he wasn’t making decisions on the fly. After years of honing his approach, in 2024 he decided to put his skills to the test in the US Investing Championship.
As of August, he’s in the lead for his division, up by 253%, according to the competition’s founder, Norman Zadeh.
Trading on episodic pivots
When Flanders was honing his skills, he watched numerous interviews of other traders who shared their strategies. One pattern trade in particular grabbed his attention: the episodic pivot, which happens when a catalyst — such as positive news or earnings — leads to a sudden shift or move in a stock’s price. The theory behind the episodic pivot is that this initial move higher — also known as a “gap up” — will retain momentum and continue to deliver gains. That expectation of further upside rationalizes the decision to buy when a stock or security has already seen a sizable jump.
On a chart, it can often look like a wide space between two candles after the stock’s price opens significantly higher than where it was in premarket hours.
“I was like, wow, I’ve seen these trades before. In the past, I was too gun shy to take them because when a stock is gapping up 30%, the idea of buying it is very unnatural for something that’s up that much,” Flanders said.
However, not all gap-ups on a chart are a buy signal. After all, if a stock has already risen so much, its upside may be capped. Flanders learned that the hard way after piling into a few that crashed. He was eventually able to pinpoint his main mistake: the stocks he was targeting had weak fundamentals and volume.
“They started breaking out and I bought them aggressively and they all failed. And I just kept getting stopped out,” Flanders said.
So he crafted a process that would help him avoid these sorts of unsustainable share pops. One of the things he did was avoid trading less liquid stocks such as smaller-caps that aren’t as well-followed. Instead, Flanders says he sticks to stocks with higher institutional ownership that are near or at their all-time highs and have recently consolidated.
In his mind, these indicators suggest that demand is sustainably strong even when there’s selling pressure. It reduces the chances that the stock’s rally is short-lived, an outcome that could cause traders to get trapped holding the bag if it reverses.
Large volume should accompany this demand, ideally, the most the stocks has ever had, he added.
“The goal is to buy a stock and sell at a higher price. To do that, you need to find stocks that are in high demand where people want the stock and they’re willing to bid up,” Flanders said.
Finding the trade
The first thing Flanders does on a given day is check his scanner for the top movers of the day during pre-market hours. He then singles out tickers that are up by 10% and trading above $10 with an average daily volume above half a million shares. Then he checks the news to confirm that they have a strong catalyst. On most days, there aren’t any stocks, on some days there could be a few.
If he finds a stock that meets his criteria, he reviews its 12-month chart to confirm it has been on a strong uptrend, up by a minimum of 100% from its 52-week low before consolidating for a minimum of 7 weeks.
“They call it trading, but it’s really waiting because 95% of the time you don’t do anything,” Flanders said.
If he decides to take a trade, he will buy the stock at the open. His initial stop-loss order is often set 5% below his entry price. If the stock moves up, he will take some gains. His stop-loss will then move up, trailing the 10-day moving average, allowing him to ride the rally for weeks until he stops out.
This strategy has a low win ratio, at about 30%, because the volatility will often stop him out. However, on average he says his gains are five times as big as his losses. This is because his stop loss limits the amount he can lose while allowing him to rid the stock higher.
Trade example
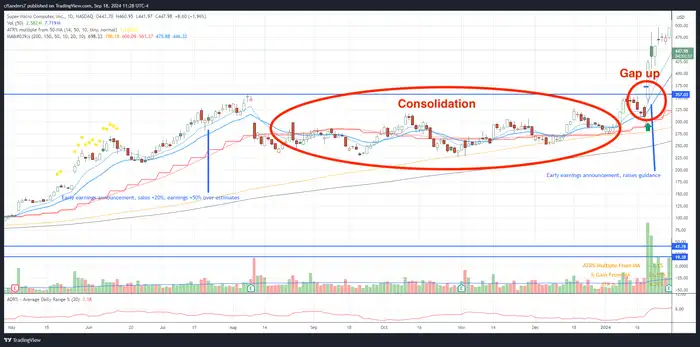
On January 18, IT Solutions Provider Super Micro Computer’s (SMCI) met all the characteristics outlined above. It had an earnings report after the closing bell that was the type of event capable of generating a gap-up. The stock was also coming off a strong 12-month uptrend and a consolidation period that lasted five months.
On January 19, during pre-market hours, the stock’s price spiked, causing a gap up on the opening. Flanders purchased 900 shares at about $348 a share within two minutes of market open. In this trade, Flanders didn’t take profits early because he liked the momentum he saw in the breakout. He ultimately decided to hold until February 5, when he scaled out between $598 and $621 a share.
For his efforts, Flanders reaped a gain of around 74%, or $230,000.
The chart below demonstrates SMCI’s strong uptrend, consolidation and gap up.