‘All the pieces are in place for this bull market to end’: A technical strategist who called the S&P 500’s surge to 6,000 warns that stocks are a negative catalyst away from a 20% drop

Back in February, Tyler Richey laid out an argument for why the S&P 500 could climb all the way to 6,000. Investor sentiment was bullish but not excessively so. The Dow Jones Transportation Index had surged into the green for the year alongside the S&P 500, a sign that the economy was in a good place. And the S&P 500’s relative-strength index had been above 70 for three weeks, which historically meant a rally could go on for much longer.
It was a bold call at the time for the technical strategist and co-editor of The Sevens Report, a research firm with clients like JPMorgan, Charles Schwab, and UBS. With the index at around 5,000, the projection meant another 20% upside on the back of what had already been a monster 40% rally from October 2022 lows. It was also well above the price targets of Wall Street’s top strategists.
Today, the gains have come to fruition, with the S&P 500 crossing the 6,000 mark in November, thanks in large part to optimism around artificial intelligence, the health of the US economy, and the potential for deregulation under Trump.
Now, Richey is seeing signs that the party could end sooner than people may realize, he told B-17 this week.
While the strategist isn’t necessarily bearish in the immediate term and said the rally could continue if left uninterrupted, he cautioned that the market is one piece of bad news away from toppling.
“Looking ahead, the collection of market indicators and cyclical signals we monitor suggest all the pieces are in place for this bull market to end in the weeks or months ahead and for a cyclical bear market to begin,” Richey said in an email, adding: “There is nothing in the current fundamental backdrop that suggests a bear market in stocks is a sure thing or even likely for that matter.”
The technical indicators
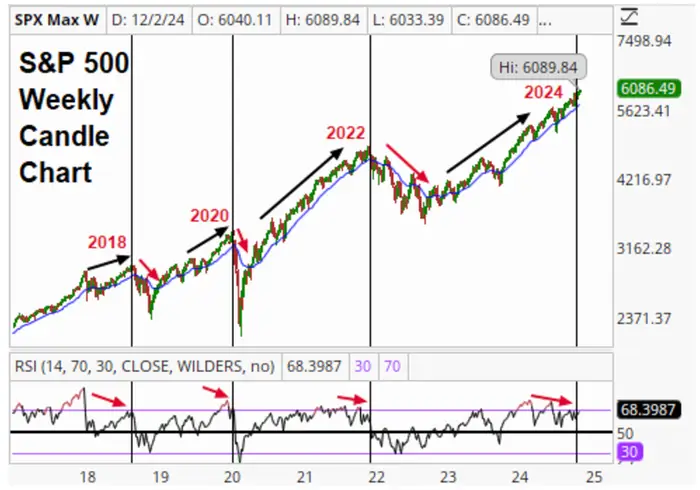
Richey unpacked a number of technical indicators backing up his thesis, including the S&P 500’s relative strength index (shown at the bottom of the chart below).
The RSI measures price momentum, and a reading of 50 is neutral. Readings below 30 and above 70 signal momentum is weak or strong, respectively. It is currently sitting below 70, even though the index is at all-time highs, a divergence that suggests momentum could be weakening.

“Weekly RSI failing to ‘confirm’ the new highs in the S&P 500 is a dynamic we have seen leading up to every major market pullback in modern market history, including the tech bubble bursting and the GFC recession,” he said in an email, referencing the 2000 and 2008 stock market crashes.
Second, investor sentiment, often viewed as a contrarian indicator, is at an all-time high. The Conference Board said that more than 56% of consumers believe the stock market will be higher in 12 months’ time, which could signal that the rally is getting frothy and detached from fundamentals.
Global M2 money supply — essentially the amount of money in savings accounts — is also shrinking, which typically bodes poorly for risk assets like stocks, he said. That signals that liquidity in the economy is drying up, with less money floating around for stocks to absorb.
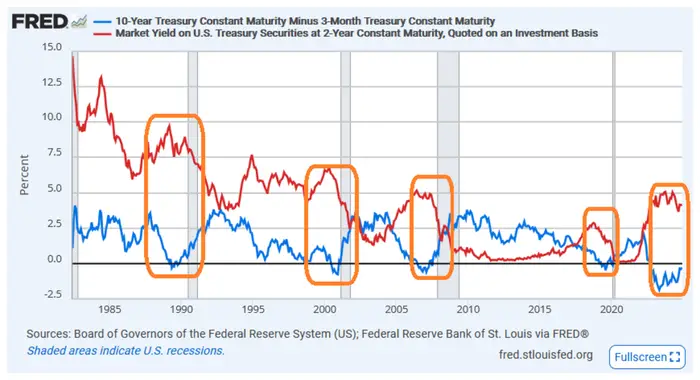
The yield inversion for the 3-month Treasury bill and the 10-year note (blue line), meanwhile, is starting to shrink as the Fed cuts rates while yields on 2-year notes (red line) fall. Yields on the 3-month and 10-year have inverted before every recession since the 1960s, and do so because the Fed raises short-term rates while investors become worried about the health of the economy, causing them to seek safety in long-term risk-free assets like the 10-year. That demand drives up their price and pushes down their yield. Like the 3-month, yields on 2-year notes also track closely with the fed funds rate.

Richey’s downside target is around 4,800, which would mean a 21% setback for the S&P 500 and a reversion to valuation norms. In the case of a recession, the market could fall all the way toward 3,500, he said.
Fundamentals first
As Richey says, technical indicators allow for pattern recognition over time, but they are just one factor to consider when analyzing the market. Fundamentals are the more important driver of stock performance.
Right now, most strategists and economists argue that economic fundamentals are sound. Unemployment claims remain low. Consumers keep spending. And the Fed looks poised to continue to lower rates, which should spur more economic activity.
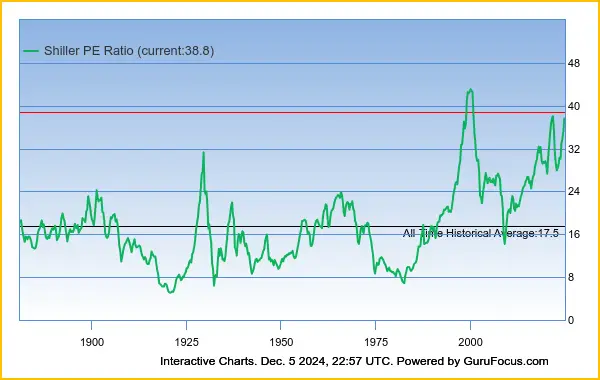
But the market is historically expensive, with the Shiller CAPE ratio rivaling levels seen in 2000 and 1929. Top Wall Street veterans like Goldman Sachs’ David Kostin and Research Affiliates’ Rob Arnott have pointed this out in recent months.
A negative development that calls into question the market’s ebullient outlook could, therefore, spook investors and spark selling.

Jobs data, for example, suggests hiring is cooling, and weak numbers in the months ahead could derail the soft-landing narrative, Richey said. There’s also some risk to the economy continuing on its hot steak, which could keep inflation well above the Fed’s 2% target. That could result in fewer rate cuts than expected, prompting investors to reassess their outlook.
So far this year, the market has taken most negative news in stride, proving bearish forecasters wrong again and again. And it may continue to do so. Even the stubbornly bearish David Rosenberg, famous for calling the 2008 recession, seemed to capitulate in a client note on Thursday, acknowledging that the market could be right about AI.
“This bull phase has now lasted long enough that those of us who have been on the wrong side of the trade need to take a different tack. This is not about throwing in the towel as much as trying to get a grip on what is going on beyond just calling this a ‘bubble’ every single day. There must be more than that to what we have been seeing over the past two-plus years,” Rosenberg wrote, adding that “generative AI is a game-changer for the future. And if it is, then the multiples based on a long time frame may not be in a bubble at all.”


