Home prices are falling the fastest in these 10 US cities
Miami, Florida
While the US is finally escaping the summer heat, the last few months were anything but hot for the housing market.
Housing activity cooled notably through the season, and August marked the slowest one in five years, Realtor.com said.
The month notched the largest number of homes for sale since May 2020, with properties averaging 53 days on the market.
According to Realtor.com’s August Housing Report, these conditions have helped home prices slip lower across the country. Homeowners are trimming prices to revive buyer interest, which has dropped off amid record price highs and elevated mortgage rates.
The median home price fell 1.3% year-over-year, reaching $429,990.
“This August, as the number of homes on the market continues to climb, price cuts are more common, asking prices are moderating, and homes are taking longer to sell,” chief economist Danielle Hale said in the report.
“Falling mortgage rates are likely to bring out additional home shoppers and a busier fall season than usual, but the boost in activity is unlikely to overwhelm the usual seasonal slowdown.”
10 US metro areas where prices are falling the fastest
Inventories continue to rise across all four US regions, but the South and West saw the greatest recovery in supply, Realtor.com said.
In August, active listings increased by 46% in the South, 35.7% in the West, 23.8% in the Midwest and 15.1% in the Northeast.
Tampa, San Diego, and Orlando notched the biggest inventory growth, which rose 90.1%, 80.4%, and 76.9%, respectively.
That’s partially in line with previous reports from Redfin. The firm noted that inventory is overflowing in Florida, which is why the Sunshine State has been leading US price declines.
Within the 50 top US markets, here are the 10 metros with the largest year-over-year drop in the median listing price.
1.Nashville, Tennessee

Nashville.
Median listing price: $550,000
Year-over-year change: -5.7%
Source: Realtor.com
2. Denver, Colorado

Median listing price: $620,000
Year-over-year change: -6.1%
Source: Realtor.com
3. Tampa, Florida

Tampa, Florida.
Median listing price: $415,000
Year-over-year change: -6.2%
Source: Realtor.com
4. Cincinatti, Ohio

Median listing price: $349,900
Year-over-year change: -6.7%
Source: Realtor.com
5. Oklahoma City, Oklahoma

Oklahoma City, Oklahoma.
Median listing price: $315,000
Year-over-year change: -7.3%
Source: Realtor.com
6. Austin, Texas

Austin, the capital of Texas and home to the University of Texas, has emerged as a promising tech hub as companies like Tesla and Google relocate their headquarters to the metro.
Median listing price: $525,000
Year-over-year change: -7.6%
Source: Realtor.com
7. San Francisco, California

San Francisco.
Median listing price: $969,000
Year-over-year change: -7.7%
Source: Realtor.com
8. Kansas City, Missouri-Kansas

Median listing price: $398,500
Year-over-year change: -8.5%
Source: Realtor.com
9. San Diego, California

San Diego.
Median listing price: $999,000
Year-over-year change: -9.1%
Source: Realtor.com
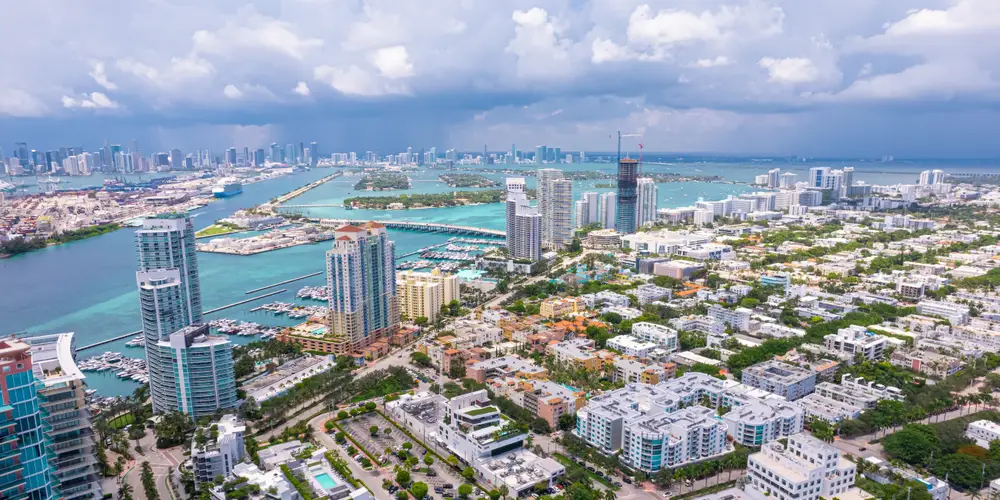
10. Miami, Florida

Aerial view of Miami, Florida, where The Connor Group has properties.
Median listing price: $530,000
Year-over-year change: -11.7%
Source: Realtor.com